Some obvious bugs were included in the new version of reading a csv-file with Validations data.
The Last columns and reading of more than one file was not working. Those are now
fixed and it should be possible to have up to 4 files with csv-files to calibrate multiruns that
are reprsenting various sites with a key variable to link with correct data.
The New option that is now also complemented with a scaling option so that the measured variables
are scaled to have the same mean values as the simulated. This is pratical especially when only
the variability pattern and not the specific variable are in focus for the comparision.
The scaling option is available by right click on the line of the validation variable in the sheet.
See below:
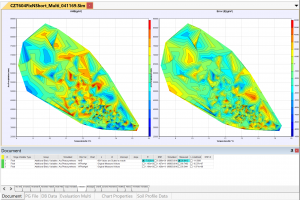
The chart show both how the residuals (between simulated and measured) and the Measured can be viewed as a function of Temperature and Precipition .
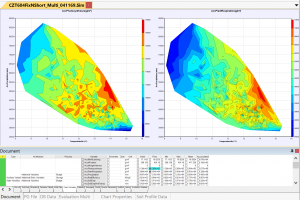
The Chart below shows the same plot but now with the Simulated GPP and the Simulated Plant Respiration.

