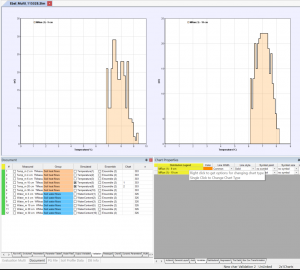
A number of new options have been created to help design of new charts for quick evaluation of data in PG-files or in the Outputfiles from MultiRuns
The New options are visible in the heading line for the Windows: PG-File and Chart Properties.
As visible in the example above a new yellow clickable column shows the current chart type and allow the user to click on the same heading to change to a new chart type.
Shiftings will be made between scatter plots, time serie plots, frequence distributions and Cumulative frequence distributions for the selected variables of the charts.
Note that Contour charts will not be affected – instead the will be created by selection of an additional second dependent variables.
A number of bugs related to the the created charts have been deleted. The change of scales and labels should now hopefully work on all data sources with various variables.
New menues with options for sett common x, common y and common z scales are available. Right click in the sheets of Chart Properties to view those menues.
The visualisation of the Modelling Efficiency performance indicator (NSE -R2) for Multiruns has been corrected.
