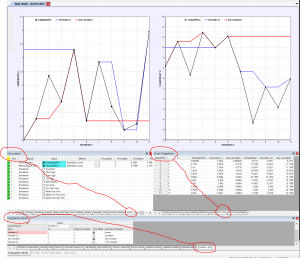
The plotting of results from multiruns can be made from all runs in the multirun of from various ensembles as has been defined by criterias in the Evaluation_Multi window.
Note that new ensemble, selection of actual Ensemble to be defined or naming of ensembles are made from the Tab Ensembles-Split.
The Ensemble -split window also has a check box to determine which of the defined ensembles that will be in Chart defined from the Document Window.
A number of bugs have been related to how the ensemble have been displayed. Hopefully most of those are now removed from the latest version.
Also the naming of the information in the Chart have been confusing and sometimes wrong….
The example below demonstrate how the results from 2 parameters can been viewed as all runs or from 2 of 4 defined ensembles.
The ChartPropeties window is using the data sheet to view actual data as a table. To export the values you can click on the PG file toolbox button and save the data from the chart a new file.
Note that ensembles are by default displayed and that you have to make an off-click in the Check box for the respectively ensemble if you do not want all to be displayed.
Please do not forget to report bugs or suggestions for the MultiRun evaluation options of CoupModel. Recently many updates have been made both for the Normal Time Serie validation and for Evaluation of SV Variables suitable for spatial representation.
