Version 5.2.6 is introduced with some different new options.
Most important is the new file format that should be a smart way to make a quick evaluation of Multiple Run simulations representing many sites. A typical such simulation is when a number of different sites are simulated by using different inputs (Driving files and Parameters).
Those simulations can now be linked to a smart flexible file that shows different type of characteristics of those sites. The smart flexible may be attached to the simulation also for completed runs. The format of the file should corresponds to a comma separated text file with
the first line as the header line and all the remaining lines are data lines.
example:
Id-Plot; Variable 1; Variable 2
2;23.1; 32.5
5;24,7; 124.566
……..
Typical the first Column should represent a key to link the variable values to a specific run of of Multi Simulation.
This is Normally the same Id as used for shiftning between meteorological files or between different soils.
After Using a link for selection of the appropiate line the use have the flexibility to combine any output variable with the information from the file.
This corresponds to the previous Single Variable Valididation. Only ME, RMSE and LogLi will be estimated for each of the runs…
In this way you will be able to obtain a total performance for all your runs providing you have a summary validation variable that is comparted to a single characteristics of each simulated sites.
Maybe more important you can also use any of those characteristics as independent variables to check if your residuals beetween simulated and obsvered has some correlation with any variables or classification of your site represented in the csv-file
Below some screen clips showing various steps in using the new files:
Right click menu in Validation Sheet of Document:

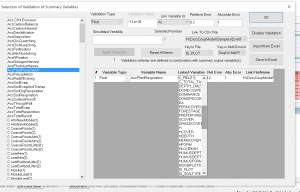
Window where you link your measured variables to simulation variables:

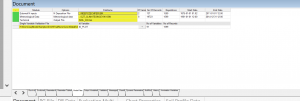
Model File sheet menu showing general information and name of file:

Validation sheet showing general about validation variables:

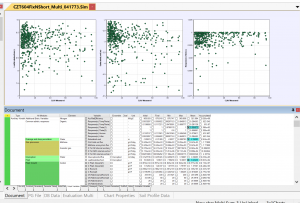
Example of chatter charts with the new variables as independent

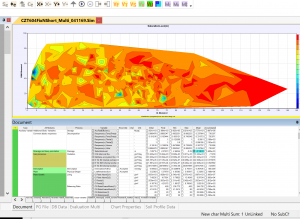
Example of contour charts with the new variables as independent
