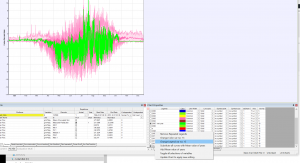
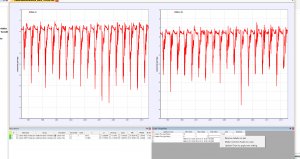
A number of bugs have been deleted that made it impossible to modify charts by using the menues of ChartProperties.
A new feature allow to change of labels also for special created variables like those that are when a chart of
within year distribution has been created.
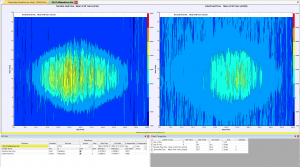
Another feature allow you to automatically obtain common scale for y or z-axis after you right click in the axis tab of Chart properties.
The feature of making time serie bu contour charts selecting x to be eg days of year an y hour of days. Then you will get mean values of all years
or optionally you can select an individual year.


