A new update with major changes with respect to normal time serie validation variables (TSV) has been made.
Most important it that the functions for making transformations of your data to allow performance indicators for various
options with accumulation of time has been fixed.
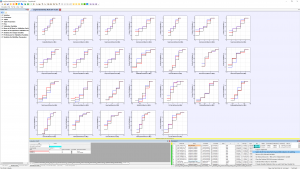
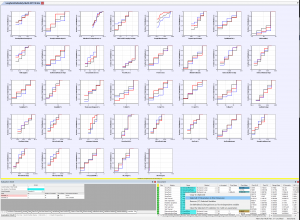
In the example below you can study have chart with the showing two posterior distributions compared with the prior distributions for performance and resulting parameters.
Note that the example is based two different criteria on normald time serie data compared with the transformed data.
By right click in the Validation or MultiRuns Sheets of the document you will find new options for plotting all your variables or parameters instead of clicking individual candidates. Note that you may have to adjust the number of charts in the X and Y direction and also adjusting in Chart Properties to obtain the Frequence distribution and options for hidden or visible legends to the individual curves.
Another new feature is that the Evaluation Sheet will now show mean values of posterior variables with a color scale code. No color indicates not change. Blue side are lower values and red side are higher as a normal heat map. Also note the the value displayed in the mean value for the posterior distrubition is changed from previous value in itself to be now the normalised value (0-1) of the mean scaled from prior min to prior max.
The colour scale is also applied in the list of the parameter mean values to give a quick indication on the direction of change. Also in the case a no color cell (0.45 – 0.55 will show similar posterior mean as prior mean.
The examples from below are based on extended application for calibration to a long term eddy flux site at Zackenberg on Greenland and was provided by Wenxin Zhang.

